
Host App
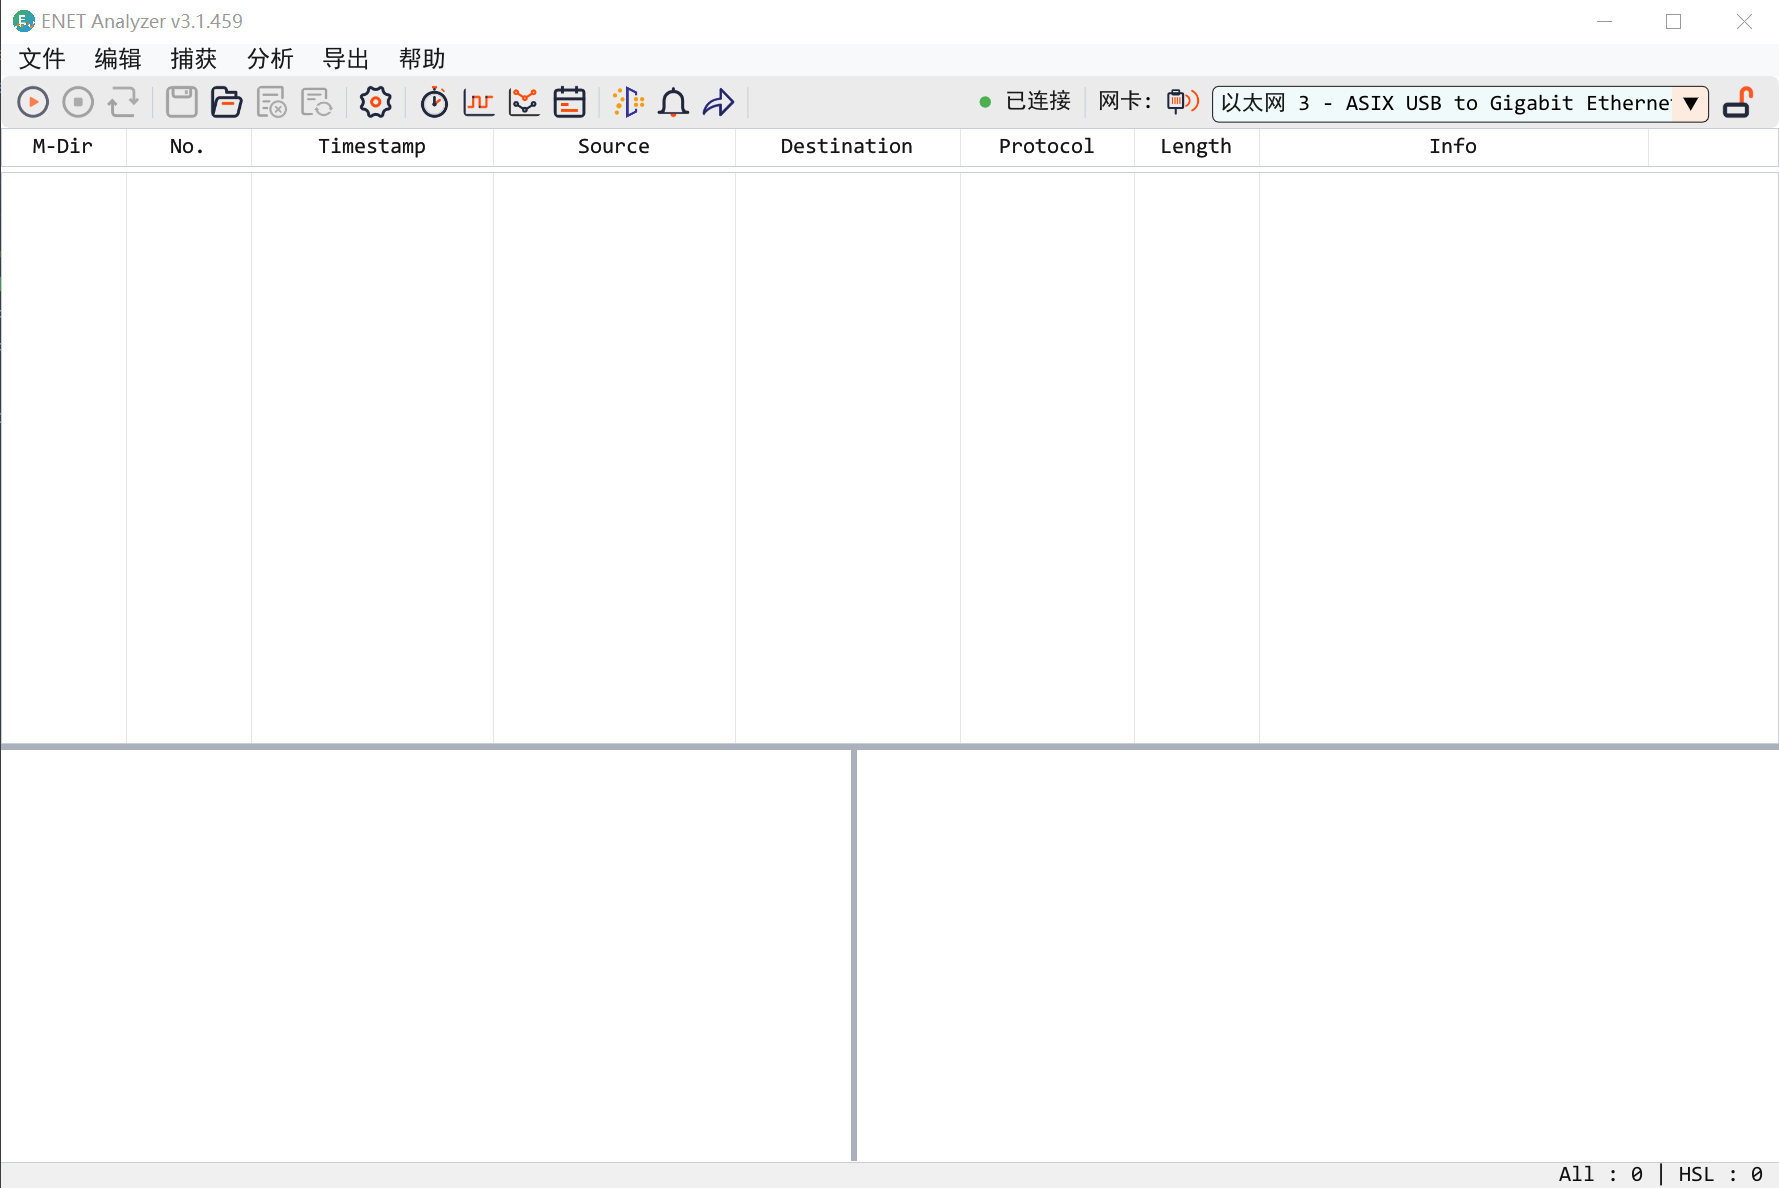
Packet List and Inline Capture
Capture live traffic, open PCAP files, filter frames, and jump by time in one desktop workspace.
Industrial Ethernet Analysis

Insert inline into EtherCAT and industrial Ethernet links for Wireshark-style capture, DC sync timing analysis, IO state trace, and PDO data matching—helping development and test teams pinpoint link issues fast.
ENET-Analyzer delivers inline capture, EtherCAT timing analysis, IO trace, and PDO parsing across the full workflow from R&D bring-up to field diagnostics.
ENET
Software Value
Host App
Capture live traffic, open PCAP files, filter frames, and jump by time in one desktop workspace.
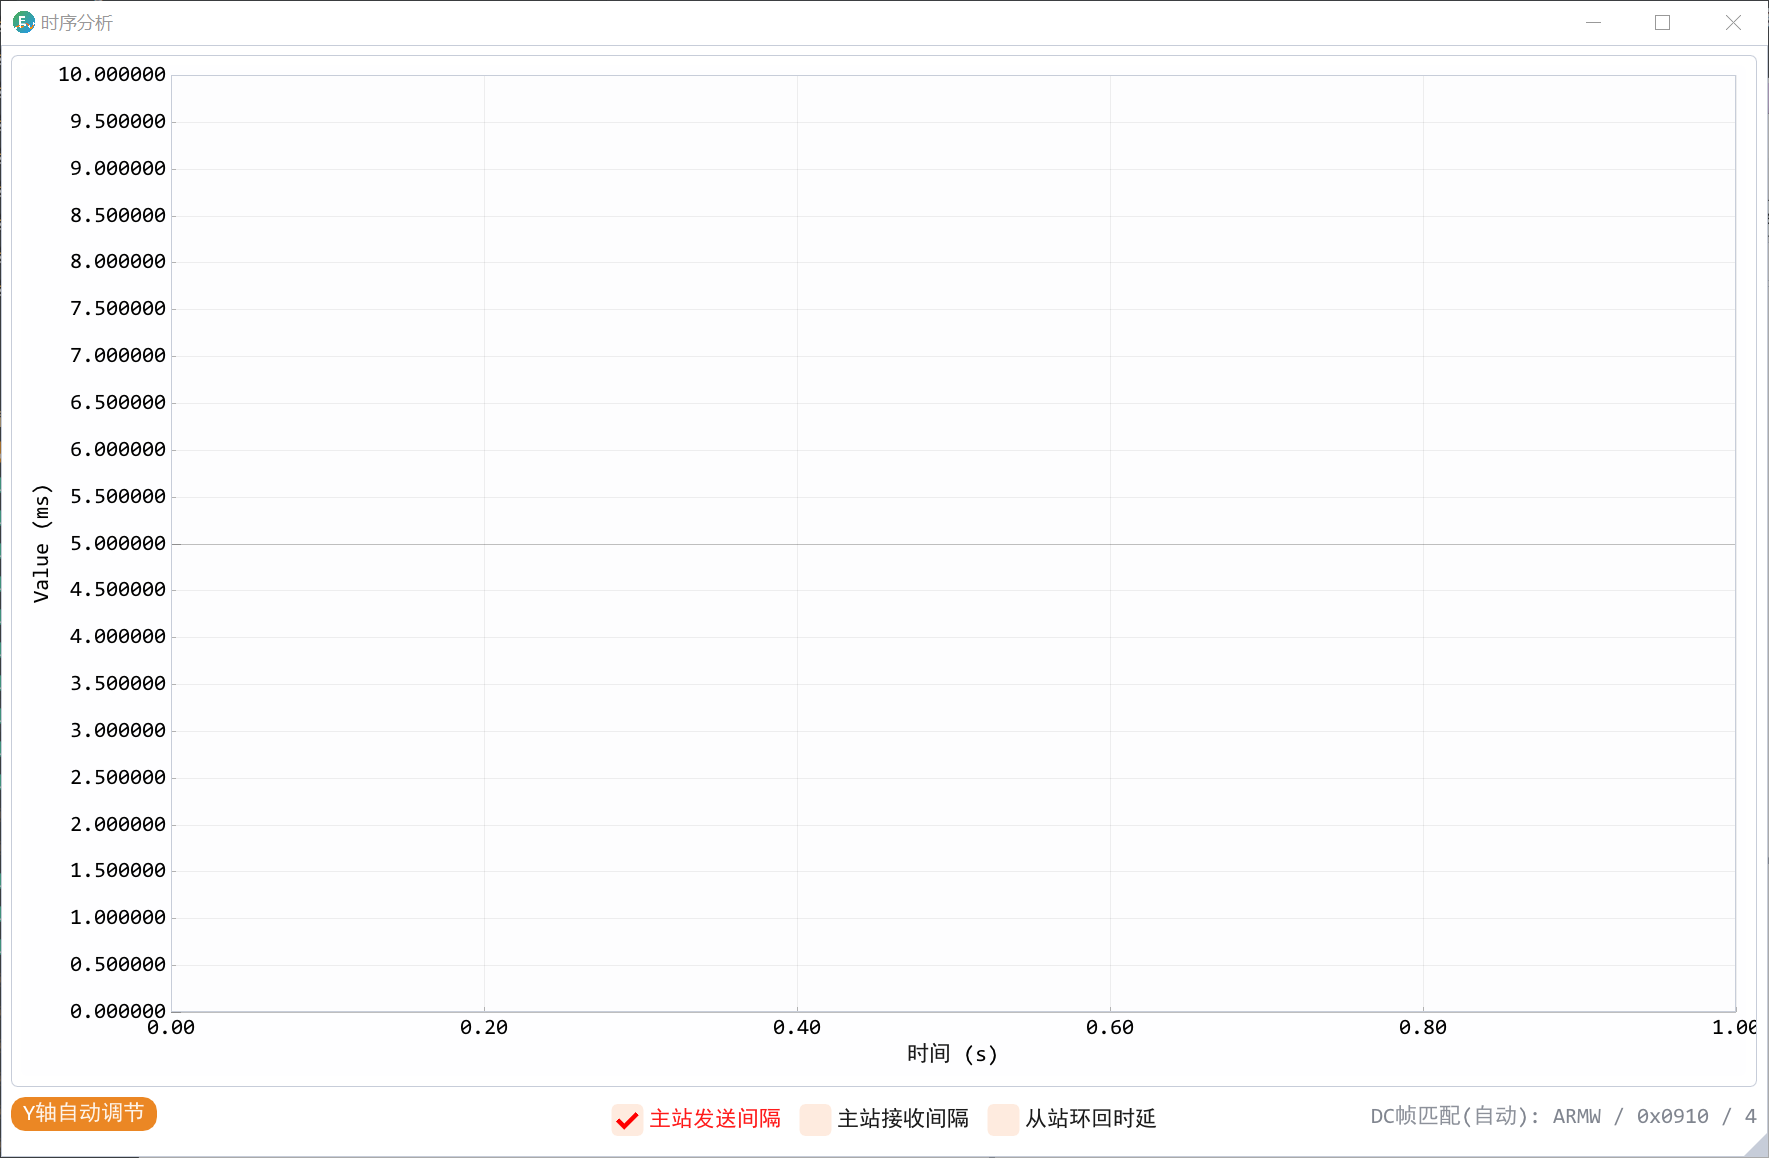
Timing
Put sync frames, cycle jitter, and abnormal points into a single view for field issue isolation.
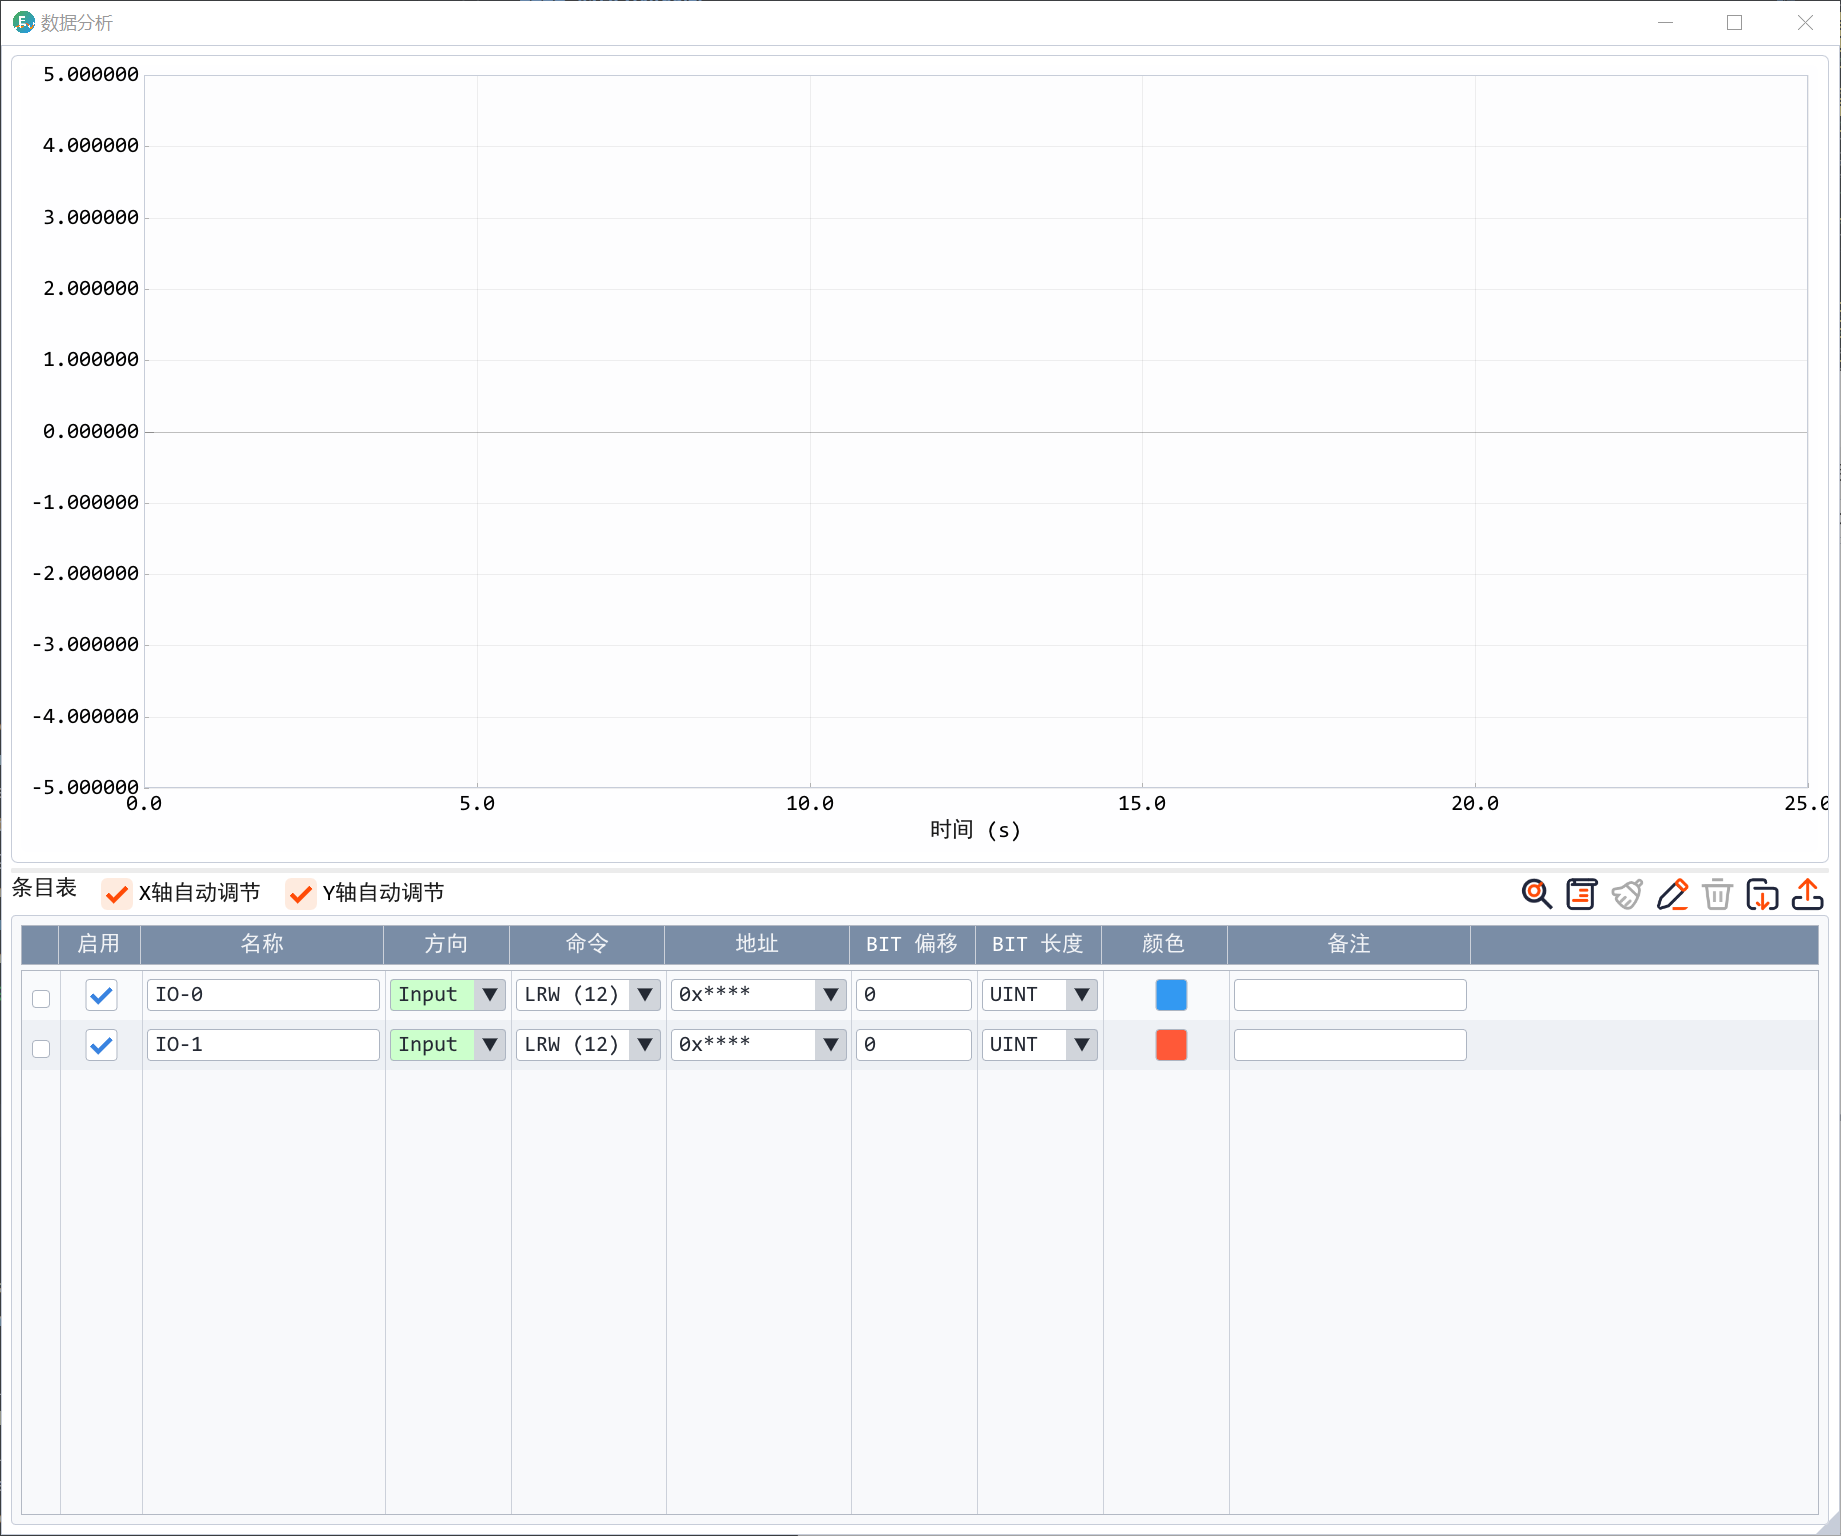
Decode
Parse process data with XML catalogs so engineers can confirm variables, mapping, and alert conditions faster.
Highlights
Real-time network adapter capture and PCAP file offline analysis
DC sync timing analysis and IO state capture
PDO auto-discovery, XML matching, and filter alerting
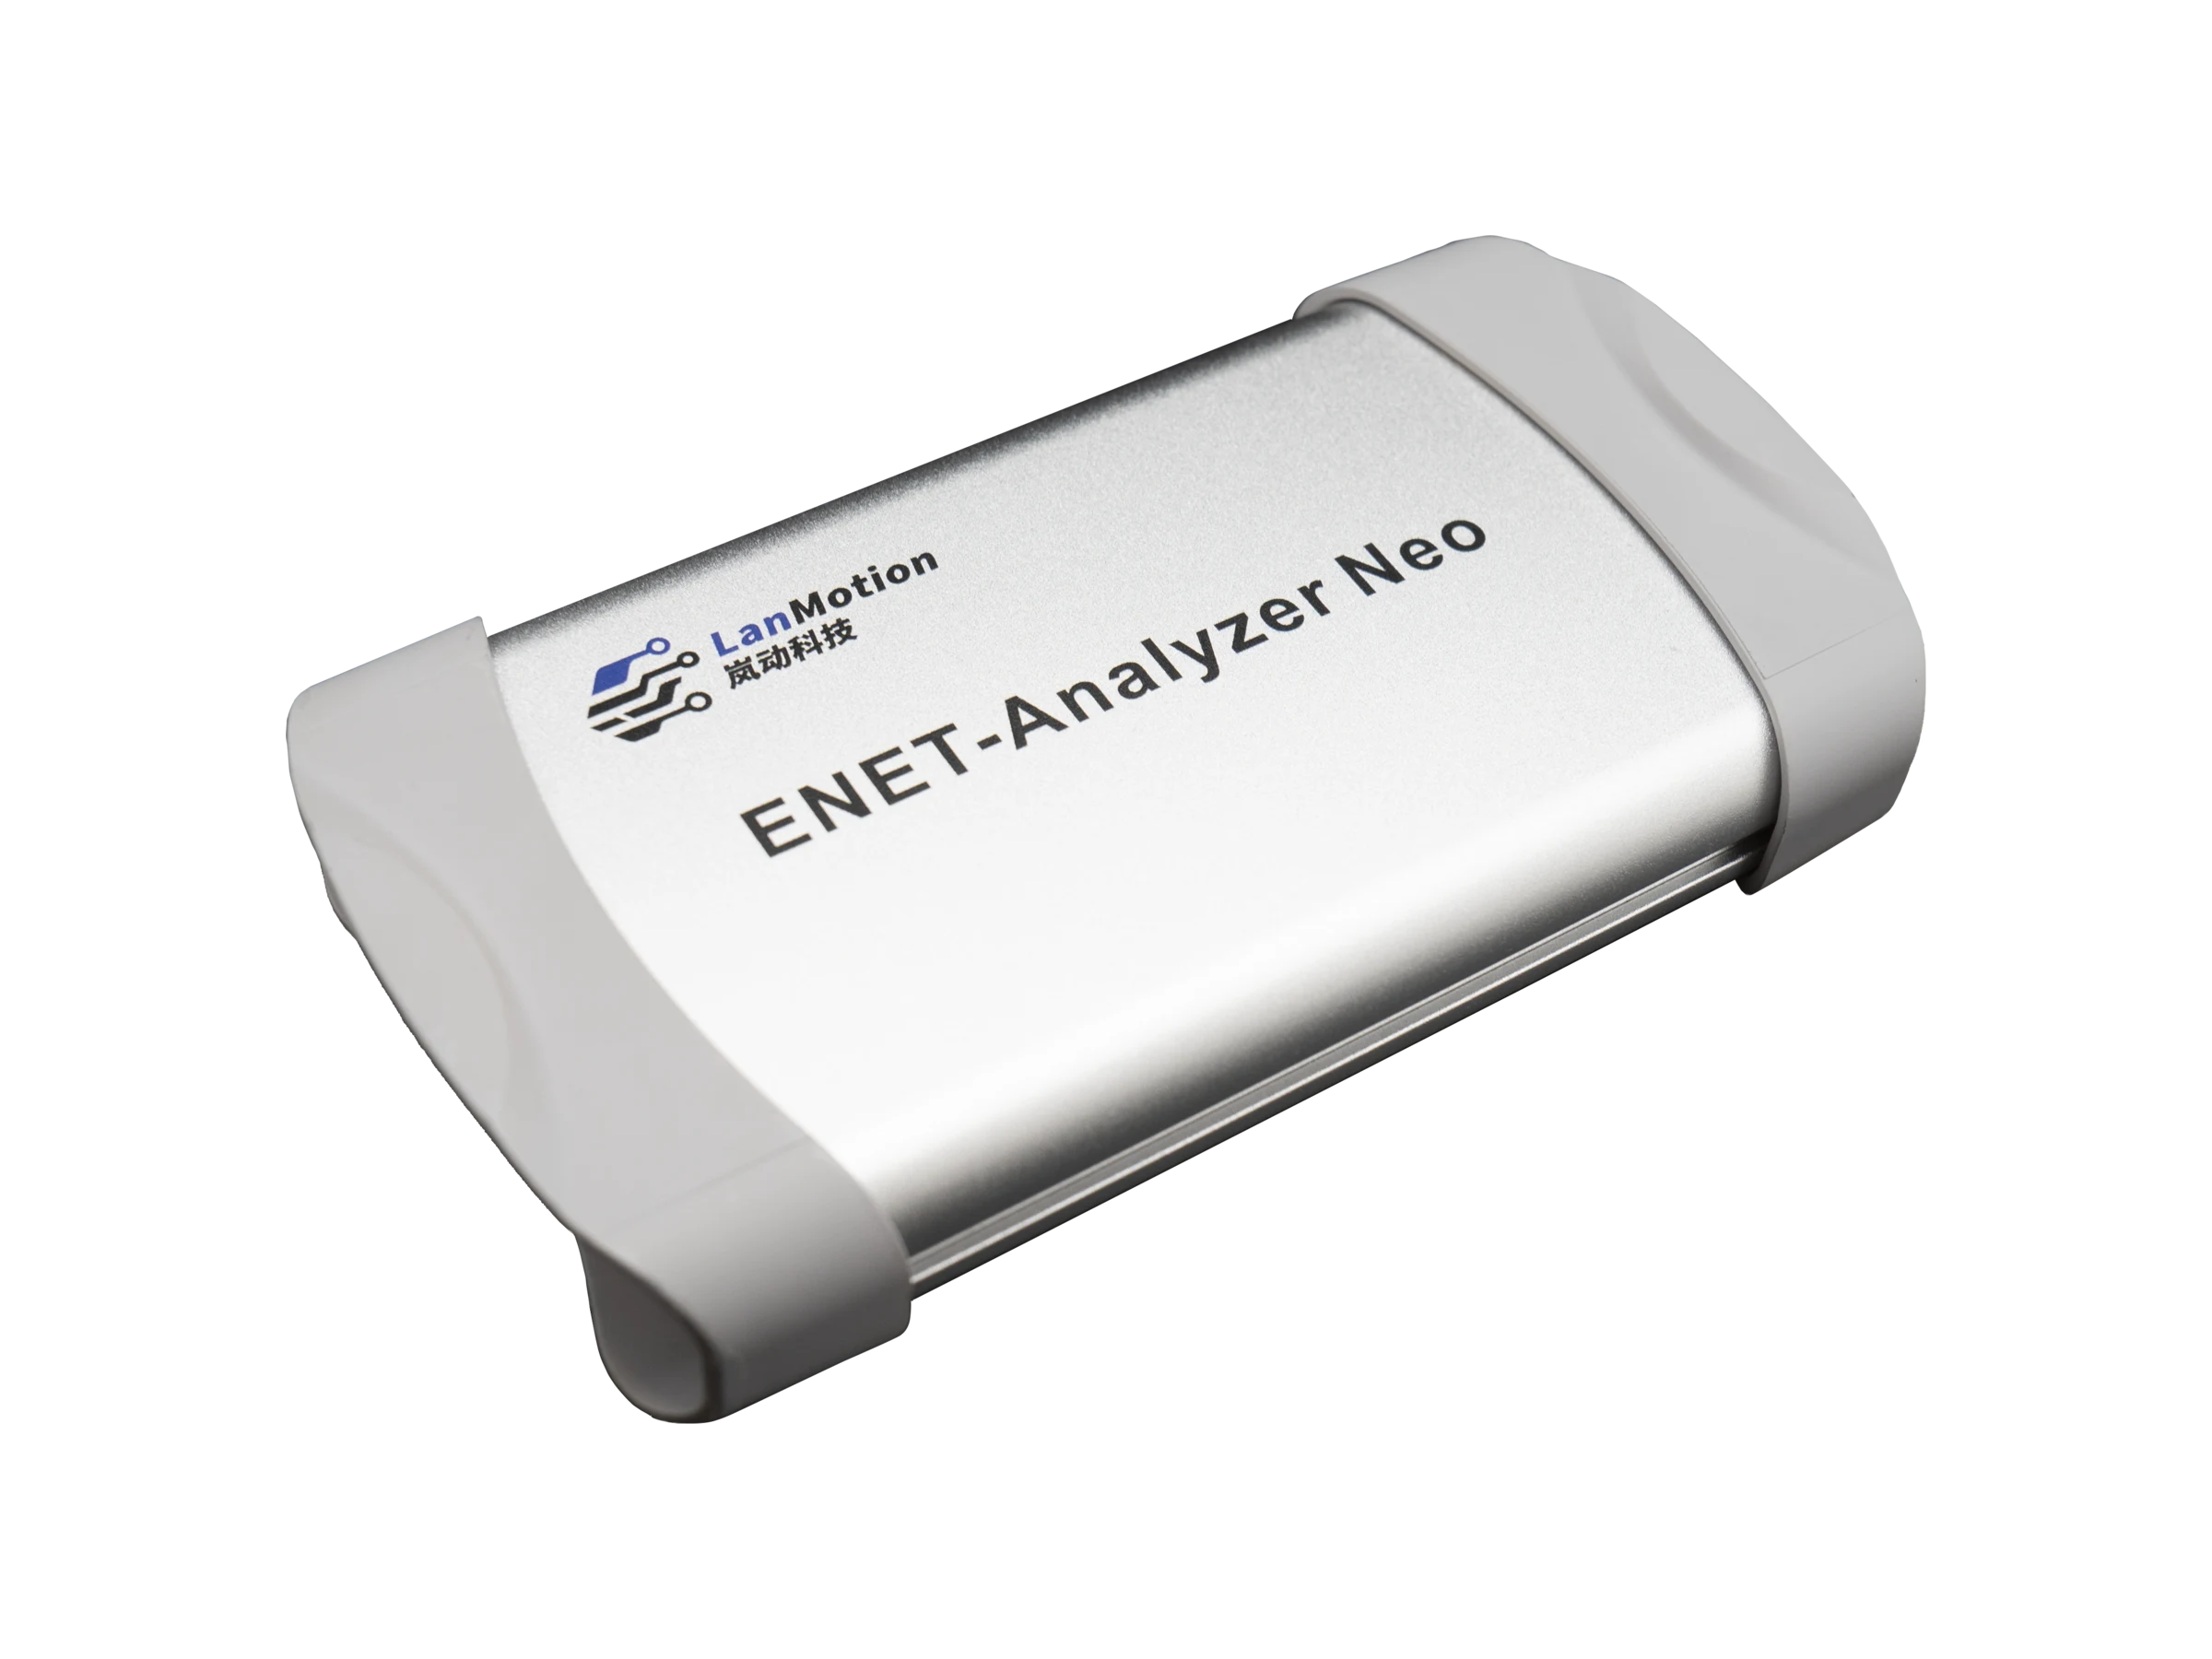
Interfaces & Status
Inline Analysis
Field traffic enters the analyzer, then moves into capture, timing, and PDO decode views in the host software.
Field Link
Host Value
Delivery
After USB power is connected, the red and yellow LEDs turn off when startup succeeds.
The software can analyze PCAP files saved by Wireshark and capture directly from the network adapter.
A solid red LED usually means the core firmware did not start successfully.
Typical Scenarios
Locate link and timing issues during EtherCAT master, slave, and device integration.
Use PCAP, alerts, and timeline jumps to reproduce and review abnormal behavior on site.
Use automatic discovery and XML catalog configuration to parse and validate PDO data quickly.
Product manuals, protocol references, and other PDF-format technical resources.
PDF / EN
English product overview for quick product positioning.
Released: 2026-06-03
Checksum: SHA256 2fdcf3ba...cd433b77
DownloadEnglish offline guide for capture, analysis, reports, and troubleshooting.
Released: 2026-06-03
Checksum: SHA256 9abe3b21...2e34bc54
DownloadFAQ
The adapter driver is usually missing, or WinPcap API-compatible mode was not enabled during installation. Reinstall the driver and try again.
A solid red LED usually means the core firmware did not start successfully. A blinking yellow LED usually indicates an Ethernet connection or speed negotiation issue.
Yes. The software can open PCAP files saved by Wireshark and combine them with analyzer-captured information for a fuller view.