ENET-Analyzer is oriented to industrial Ethernet on-site debugging, equipment joint debugging and production line problem recurrence.
It records link data synchronously through dual detection ports and sends the data to the host computer via the uplink Gigabit network.
Help users observe EtherCAT messages, DC cycle jitter, PDO data changes, and IO capture status,
And generate timing analysis reports that can be used for delivery review.
dual 100M detection port Gigabit uplink port 8ns Timestamp precision EtherCAT analysis DC Timing analysis Timing Analysis ReportPDO data chartIO capture pcap review document version V1.0
Product positioning
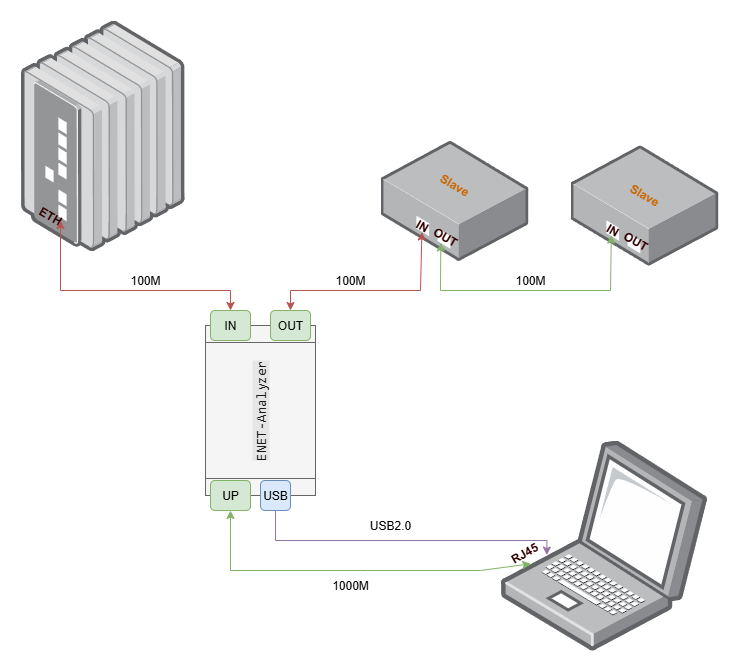
ENET-Analyzer is used to observe real messages and live timing in industrial Ethernet links. It is suitable to be placed between the master station and the slave station, and between the slave station and the slave station to record the communication process and assist the host computer to complete protocol analysis, timing analysis and data visualization.
industrial field link
EtherCAT Master Servo/IO/Sensor
→
ENET-Analyzer
dual-port detection timestamp and data upload
→
PC software
packet capture / analysis / report problem location and review
The focus of the product is not to replace the master station or slave station, but to make messages, timing and process data observable, positionable and replayable without changing the original debugging habits.
What problem is solved?
Field communication abnormality location
quickly finds abnormal frames, status changes, and key EtherCAT commands through message lists, protocol parsing, and filtering rules.
DC Period Jitter Analysis
The
host computer can automatically identify or manually specify the DC period frame, and observe the master station sending interval, receiving interval and slave station loopback delay.
PDO Data Visualization
combines ESI XML and initialization messages to automatically search for PDO mapping and draw process data such as position, speed, and status words into curves.
IO Aligned with network events
The
IO capture window can be used to observe external signal edges and analyze live action sequences together with the message timeline.
Alarm and status change tracking
monitors key status bits through alarm rules, such as quickly locating the time point when the EtherCAT status changes from OP to SafeOP.
Problem review and delivery communication
supports opening and saving pcap files, making it easy to share the same evidence data among sites, R&D, and customers.
Product features
Bypass link observation
The
analyzer is connected to the link between the master station and the slave station to observe the real communication process without changing the user's original working methods of the master station, slave station and debugging software.
dual detection port simultaneous recording
records data on both sides of the link through two 100M detection ports IN / OUT, making it easy to compare directions, delays, abnormal frames and on-site action sequences.
High-precision timestamp
8ns timestamp accuracy, sampling time is SFD, suitable for analyzing period jitter, loopback delay and short-term anomalies.
Generate timing report with one click
exports PDF reports based on timing analysis data, precipitating cycles, jitters, delays and abnormal points to facilitate customer delivery, problem review and internal review.
EtherCAT dedicated perspective
not only displays original messages, but also performs dedicated analysis around EtherCAT initialization, DC synchronization, PDO mapping, status changes and process data.
data evidence can be reused
packet capture, filtering, charts, reports and pcap files form a unified evidence chain to facilitate communication between the site, FAE, R&D and customers based on the same data.
Typical applications| scene | value |
| --- | --- |
| EtherCAT device joint debugging | Observe the master station initialization process, PDO mapping, state machine changes and abnormal messages |
| Servo debugging | Visualize CiA402 position, speed, status word and other process data |
| Production line return | Reuse packet capture files and filtering rules to verify whether device behavior is consistent |
| On-site problem recurrence | Save the real link data as pcap and bring it back to the R&D side for review |
| DC synchronization diagnosis | Analyze cycle jitter, loopback delay and master station transceiver interval, and generate timing analysis reports |
| IO timing analysis | Put external IO capture and network events on the same timeline for observation |
| Customer delivery report | Precipitate time series indicators, abnormal points and analysis conclusions into PDF reports |
Product composition
Project
Description
Analyzer body
Dual detection ports, uplink port, USB2.0, IO port
USB data cable
Power supply
Ethernet cable
Connect to host computer or field link
PC software
ENET-Analyzer desktop analysis software
Supporting information
Product introduction, PC user manual
Quick specs
Category
Summary
Detection port
2 channels / 1 pair, 100Mbps
Uplink port
1Gbps, connected to the host computer network card
USB
USB2.0 for power supply
IO port
8 channels for extended capture
Timestamp precision
8ns
Sampling time
SFD
Supporting software
ENET-Analyzer host computer, compatible with pcap workflow
Key protocols
EtherCAT, more industrial Ethernet analysis can be expanded in the future
Oriented to product usage process and host computer functions
Related products
ENET-Analyzer analyzer and host software
Document version
V1.0
1. Software positioning
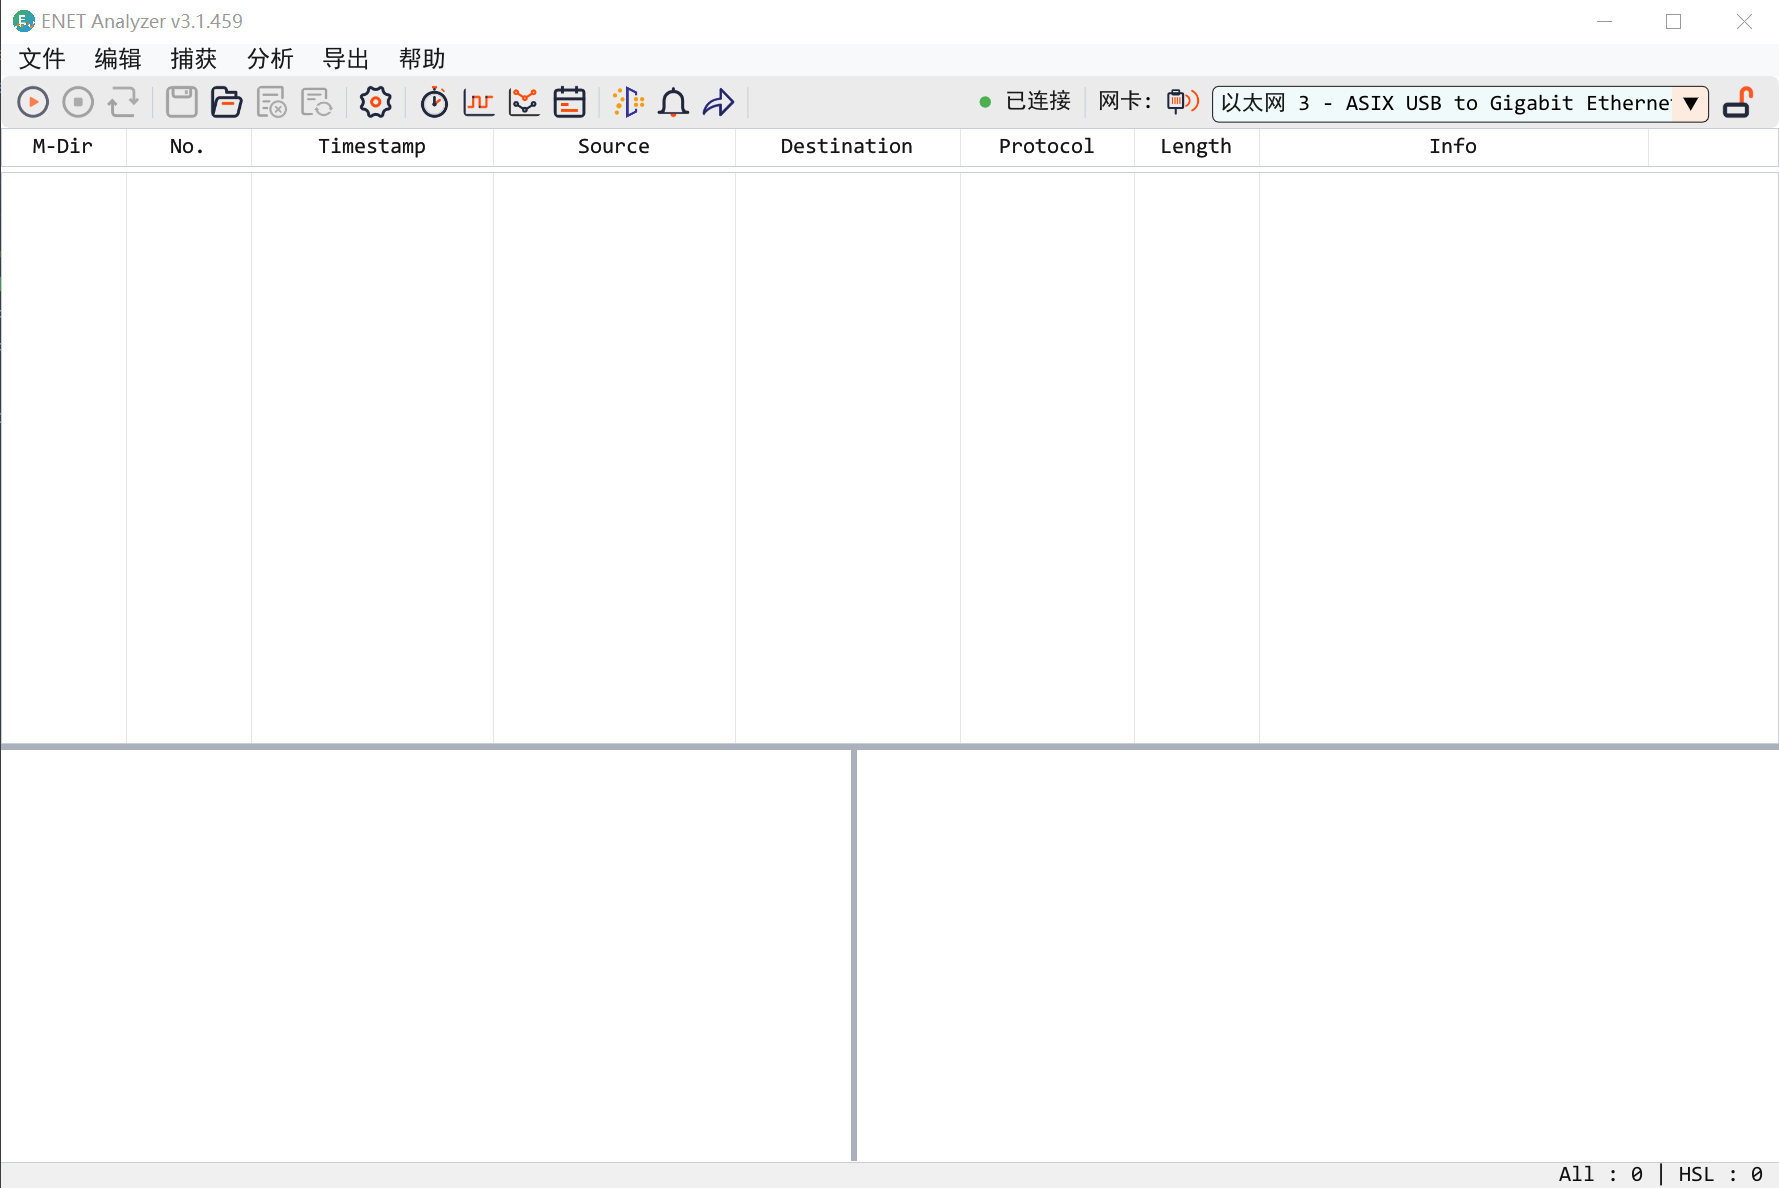
The ENET-Analyzer host computer is a desktop analysis software used with the analyzer. Its interface style is close to Wireshark, but it adds dedicated functions such as timing analysis reports, PDO data charts, IO capture, alarm location, and on-site review for EtherCAT debugging.
The software is suitable for the following tasks:
Real-time packet capture from the analyzer uplink port.
Open and save pcap files.
Parse EtherCAT messages and common network fields.
Filter data by time, protocol fields, EtherCAT addresses and commands.
Automatically identify DC sync frames and analyze period jitter.
Export timing analysis PDF reports and timing data.
Convert PDO process data to curves.
Capture IO status changes and link them with network events.
2. Preparation
Please confirm before use:
Analyzer body.
USB cable.
Ethernet cable.
For Windows computers, it is recommended to use PCIE Gigabit network card.
The ENET-Analyzer host computer has been installed.
Npcap is installed and WinPcap API-compatible Mode is checked.
If you need to use Wireshark to observe ESL messages, you can enable ESL and esl_eth protocols in Wireshark.
3. Complete the first packet capture in five minutes
3.1 Wiring
USB connection to the analyzer for power supply.
Connect the field link to the analyzer IN/OUT detection ports.
Connect the analyzer’s UP port to the computer’s Gigabit network card.
Wait for the device to start up and the red and yellow LEDs to turn off normally.
3.1.1 Interface and wiring description
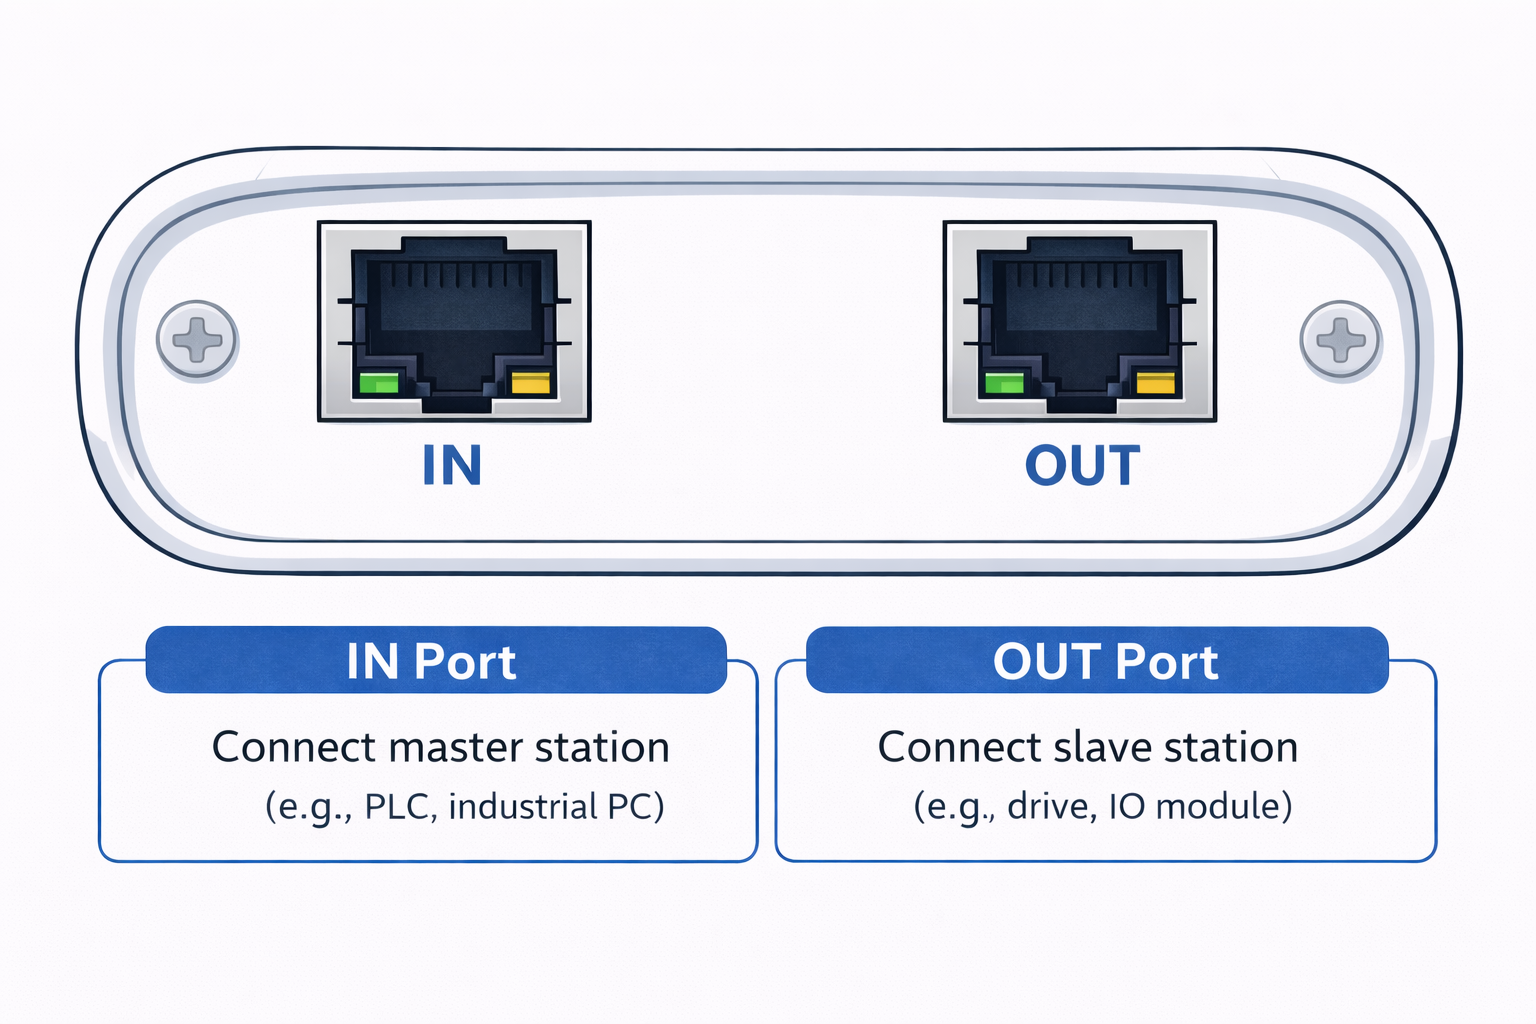
The left-side IN / OUT ports are used to insert the analyzer into the field EtherCAT link. Connect the IN port to the master side, such as a PLC or industrial PC. Connect the OUT port to the slave side, such as a servo drive, remote IO module, or downstream EtherCAT slave. After wiring, the analyzer captures link packets without changing the field communication direction.
Interface
Connect to
Function
Wiring notes
IN port
EtherCAT master side, such as PLC, motion controller, or industrial PC
Receives the master-side link signal and captures packets in both the master transmit and return directions
Connect to the master side with the original field cable or an equivalent 100 Mbps Ethernet cable
OUT port
EtherCAT slave side, such as drive, IO module, gateway, or downstream slave
Connects the slave link and keeps the master-to-slave communication path
Connect to the first slave or downstream link that was originally connected to the master
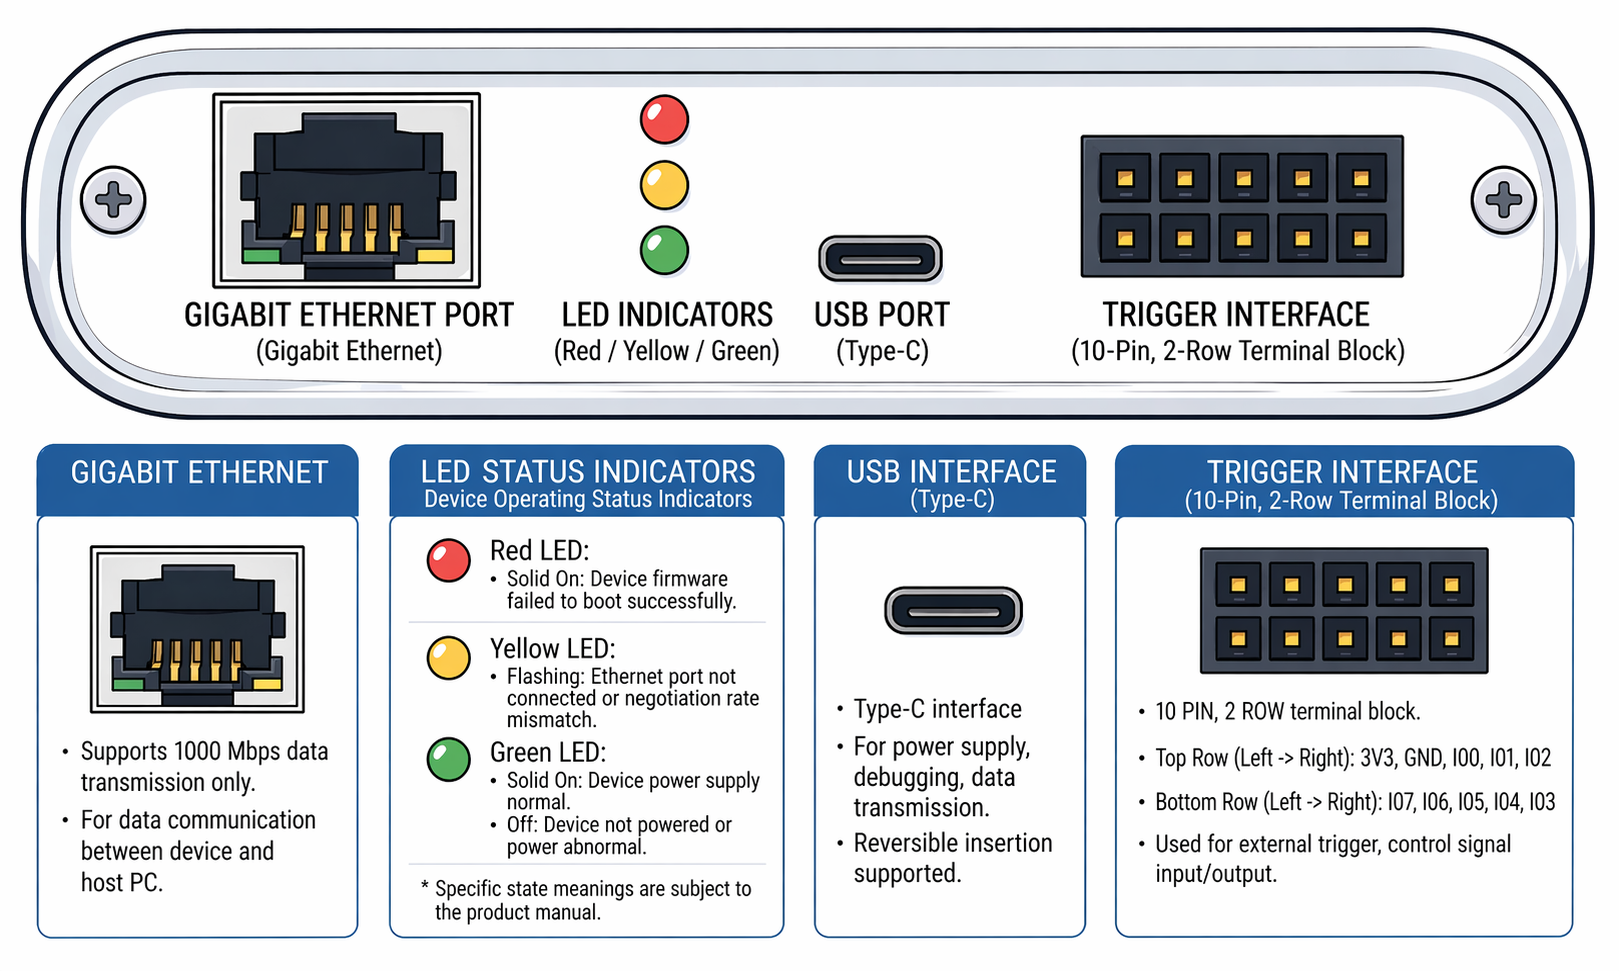
The right-side interfaces are used for PC connection, power supply, status indication, and external trigger / IO capture.
Interface / Indicator
Function
Wiring or status notes
Gigabit Ethernet port
Connects to the PC and transfers captured data to the ENET-Analyzer software
Connect to the computer's Gigabit network card; this port is for host communication only and should not be connected to the field EtherCAT master or slave
USB Type-C
Device power supply, debugging, and data transmission
Connect to the computer or a stable power source with a USB cable; reversible insertion is supported
10-pin, 2-row trigger interface
External trigger, control signal input/output, and IO capture assisted analysis
Top row from left to right: 3V3, GND, IO0, IO1, IO2; bottom row from left to right: IO7, IO6, IO5, IO4, IO3
Red LED
Firmware boot status
Solid on usually means the device firmware failed to boot successfully
Yellow LED
Ethernet link status
Flashing usually means the Ethernet port is not connected or the negotiated rate does not match
Green LED
Power status
Solid on means the power supply is normal; off usually means the device is not powered or the power supply is abnormal
Port notes:
IN and OUT detection ports only support 100Mbps, not 10Mbps.
The UP uplink port only supports 1000Mbps and does not support 100Mbps / 10Mbps.
If the yellow LED flashes, it usually means that the network port is not connected correctly or the negotiated rate does not match.
If the red LED comes on and does not go out, it usually means the device is not starting up properly.
3.2 Software operation
Open the ENET-Analyzer host computer.
Click to automatically find the device network card, or manually select the network card corresponding to the UP port.
Click Lock after the background of the network card turns light green.
Click to start packet capture.
Reproduce live action.
Click Stop.
Click Save to export the pcap file.
4. Software main interface
The main interface consists of device selection, packet capture control, packet list, parsing details, hexadecimal view, status bar and multiple analysis windows.
Common tool buttons:
Icon
Function
Description
Automatically find the device network card
Automatically match the network card corresponding to the upstream port after connecting to the device
Lock the network card
Confirm the current packet capture network card to avoid accidental switching
Start packet capture
Start real-time capture from the selected network card
Stop packet capture
Stop current capture
Re-capture packets
Clean the current session and start again
Open file
Open existing pcap file
Save file
Save current packet capture data
Filter
Open the filter input field
Timing Analysis
Open DC Cycle and Delay Analysis Window
Export timing report
Export the current timing analysis results as a PDF report
IO capture
Open IO capture waveform window
Data Analysis
Open PDO data chart window
Alarm
Open status alarm window
Time jump
Locate the target data frame according to the timestamp
Settings
Open system settings
5. Capture, open and save packets
Real-time packet capture process:
Select the network card corresponding to Select Ethernet port on the main interface.
Or click the Automatically find device network card button.
After the network card background turns light green, click the lock button.
Click to start packet capture.
Observe the packet list, parsing details and status bar during the packet capture process.
Click the Stop button when you need to stop.
Use the save button to save the captured packet as a pcap file.
Open the file:
Click the Open button to select the pcap file.
After opening, you can continue to use functions such as filters, timing analysis, and PDO data analysis.
Non-analyzer packet capture files may lack critical timing information, and some functions may not be available.
Save file:
Click the Save button to save the current packet capture data.
After successful saving, you will not be prompted to save repeatedly when closing the file or exiting the software.
If there are unsaved data when exiting, the software will pop up a save confirmation.
Suggestions:
Before capturing packets, confirm that the UP port is connected to a Gigabit network card.
For long-term packet capture, it is recommended to use chunked packet capture and a cache directory with sufficient space.
When the problem recurs on site, packet capture should be started before the device is powered on and the master station is initialized.
6. Message viewing and filtering
The message list is used to view captured data in chronological order. After selecting a frame, you can view the protocol fields in the details area and view the raw data in the hexadecimal view area.
Supports ==, !=, >, <, contains, and &&, || combination conditions are available.
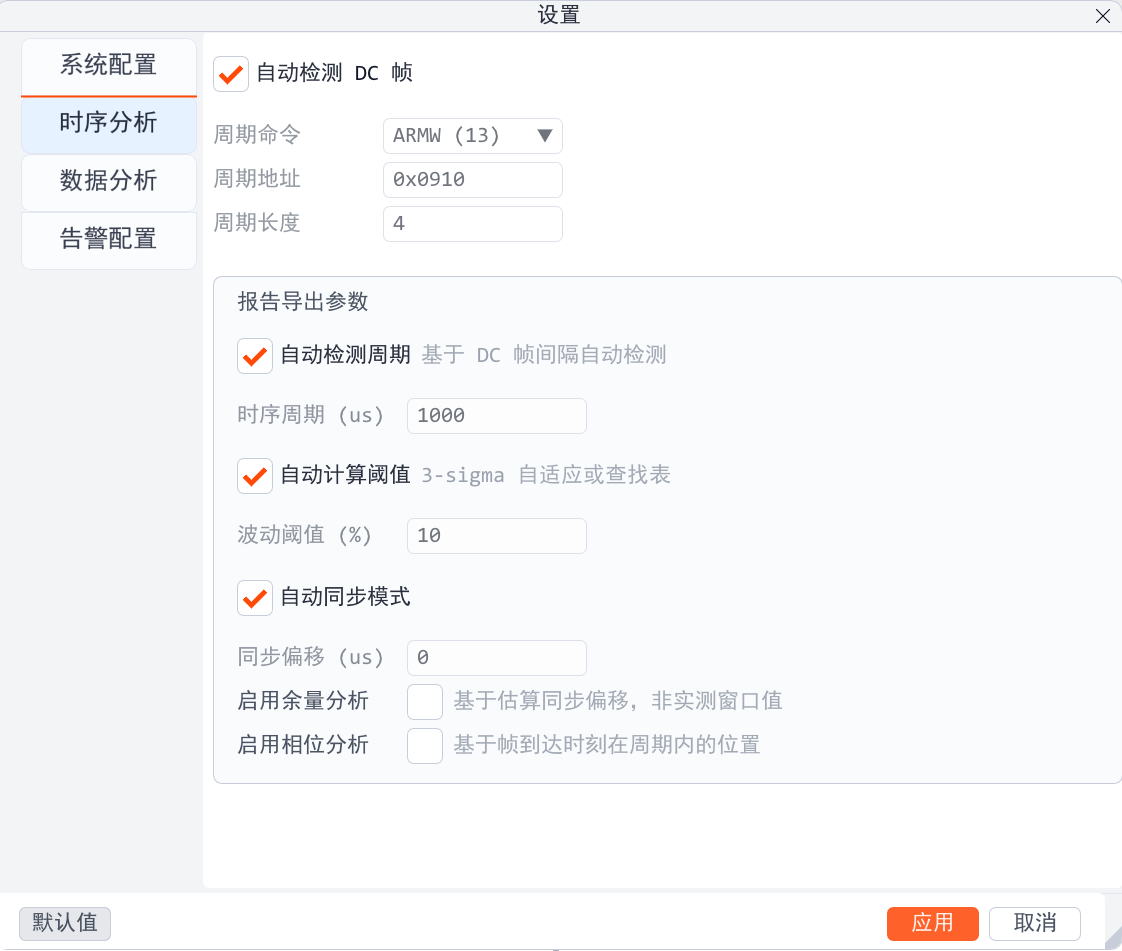
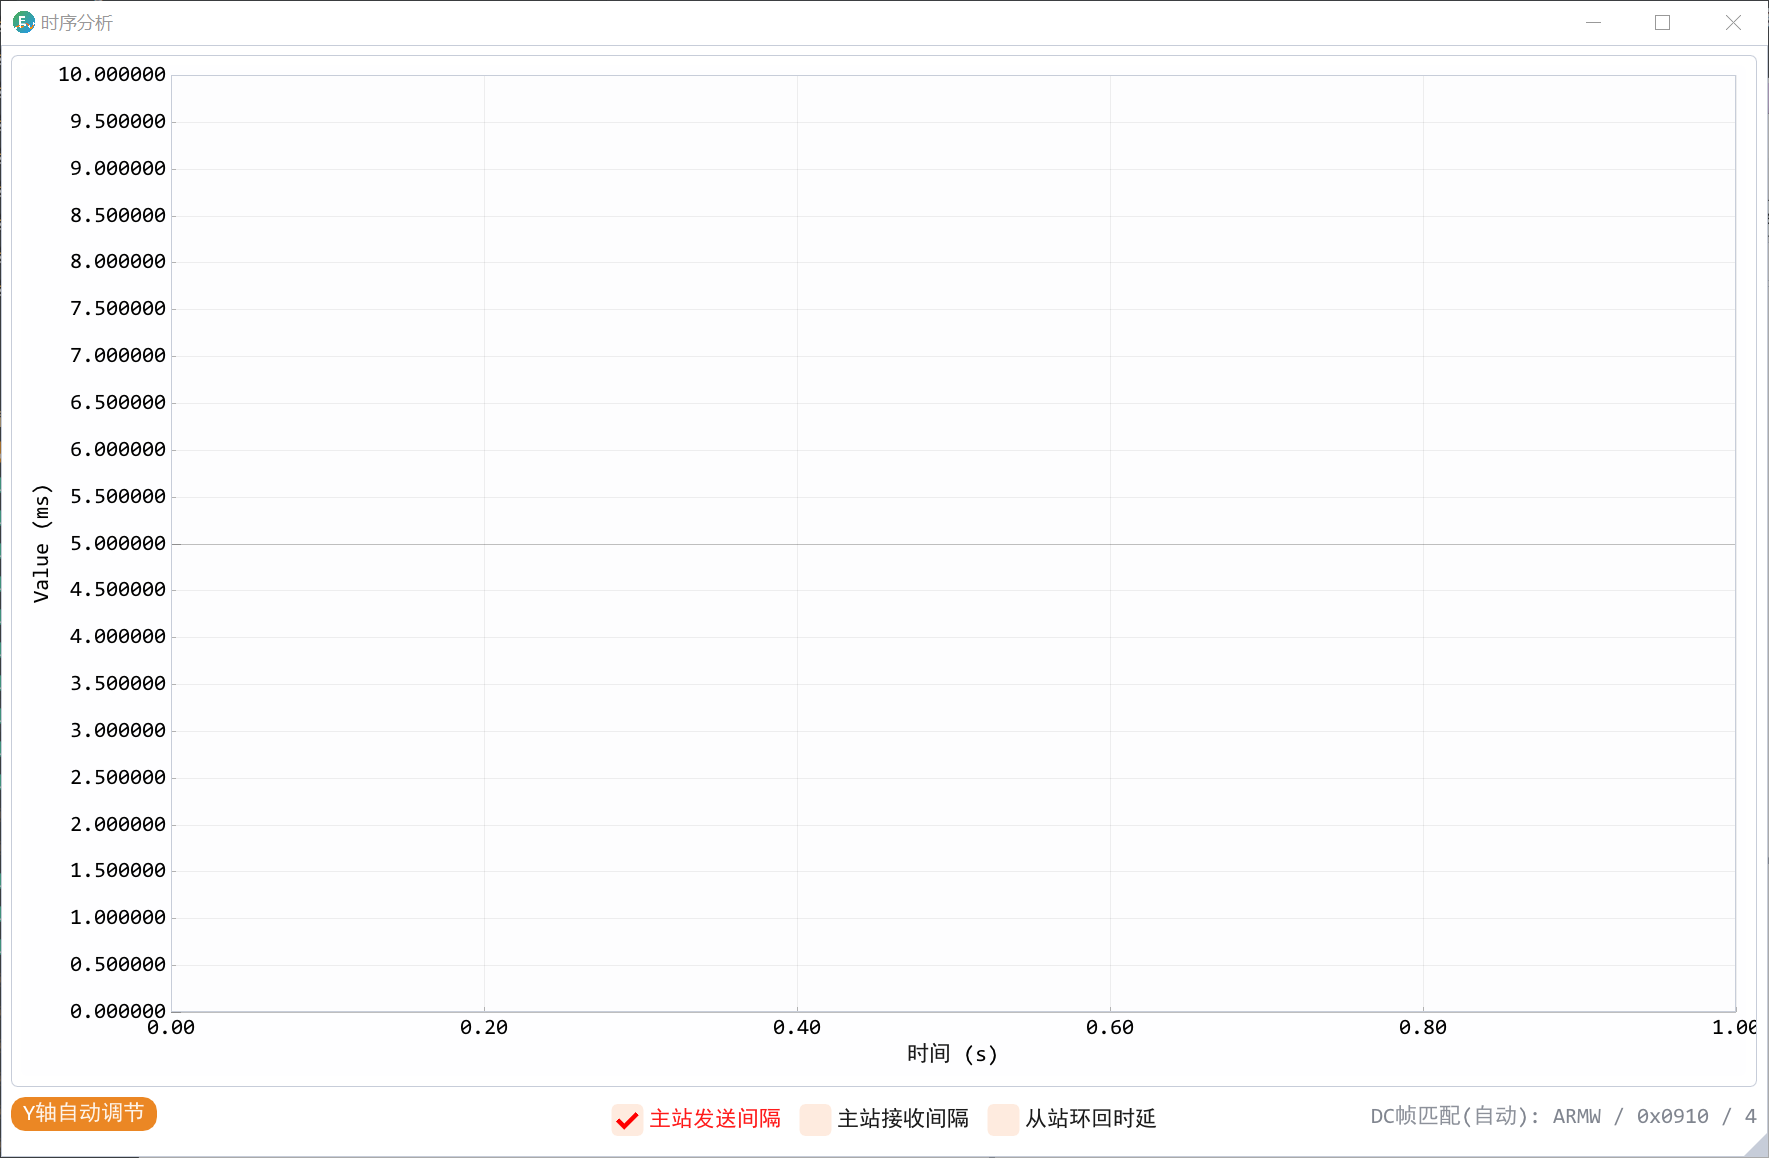
7. Timing analysis
The timing analysis window is used to observe the cycle stability of EtherCAT DC synchronization related messages.
The software supports two methods:
Automatic recognition of DC sync frames for common masters.
Manually set DC cycle command, address and command length.
Main indicators:
Indicator
Meaning
Master station sending interval
The time difference between the master station sending DC frames twice
Master station receiving interval
The time difference between the master station receiving two DC frames
Slave station loopback delay
The time difference between the master station sending through the slave station and the master station receiving point
Automatic recognition information
The lower right corner displays the DC frame recognition basis and status
Common interactions:
Right click the mouse to jump to the data frame corresponding to the waveform.
Ctrl + Mouse wheel Scales the horizontal axis.
Shift + Mouse wheel Zooms the vertical axis.
Separate scroll wheels to zoom horizontal and vertical axes simultaneously.
If the automatic identification does not meet the on-site conditions, you can view the Datagram Header in the message details, and then manually configure the DC cycle command, address, and command length.
8. Generate timing analysis report
Timing analysis reports are used to precipitate on-site cycle data into deliverable and repeatable PDF files. The report is suitable for equipment joint debugging records, exception review, test documentation and customer communication.
Generate suggestions:
First complete a packet capture containing DC periodic frames.
Open the timing analysis window and confirm that the DC frame is recognized correctly.
Manually set the DC cycle command, address and command length if necessary.
Check the master station sending interval, master station receiving interval, slave station loopback delay and other curves.
Click Export Timing Report.
Select the save path and wait for the export to complete.
The report can reflect:
Content
Value
Cycle statistics
Observe whether the cycle is stable to facilitate the evaluation of the master station scheduling quality
Jitter trend
Determine whether anomalies occur concentratedly in a certain period of time
Loopback delay
Assists in determining whether the link or slave response is abnormal
Abnormal points
Associate the abnormal time points in the chart with packet location
Analysis conclusion
Facilitate the sharing of the same results with customers and R&D on site
If you use IO capture at the same time, you can confirm the time relationship between IO events and network events before reporting, making the timing conclusion more complete.
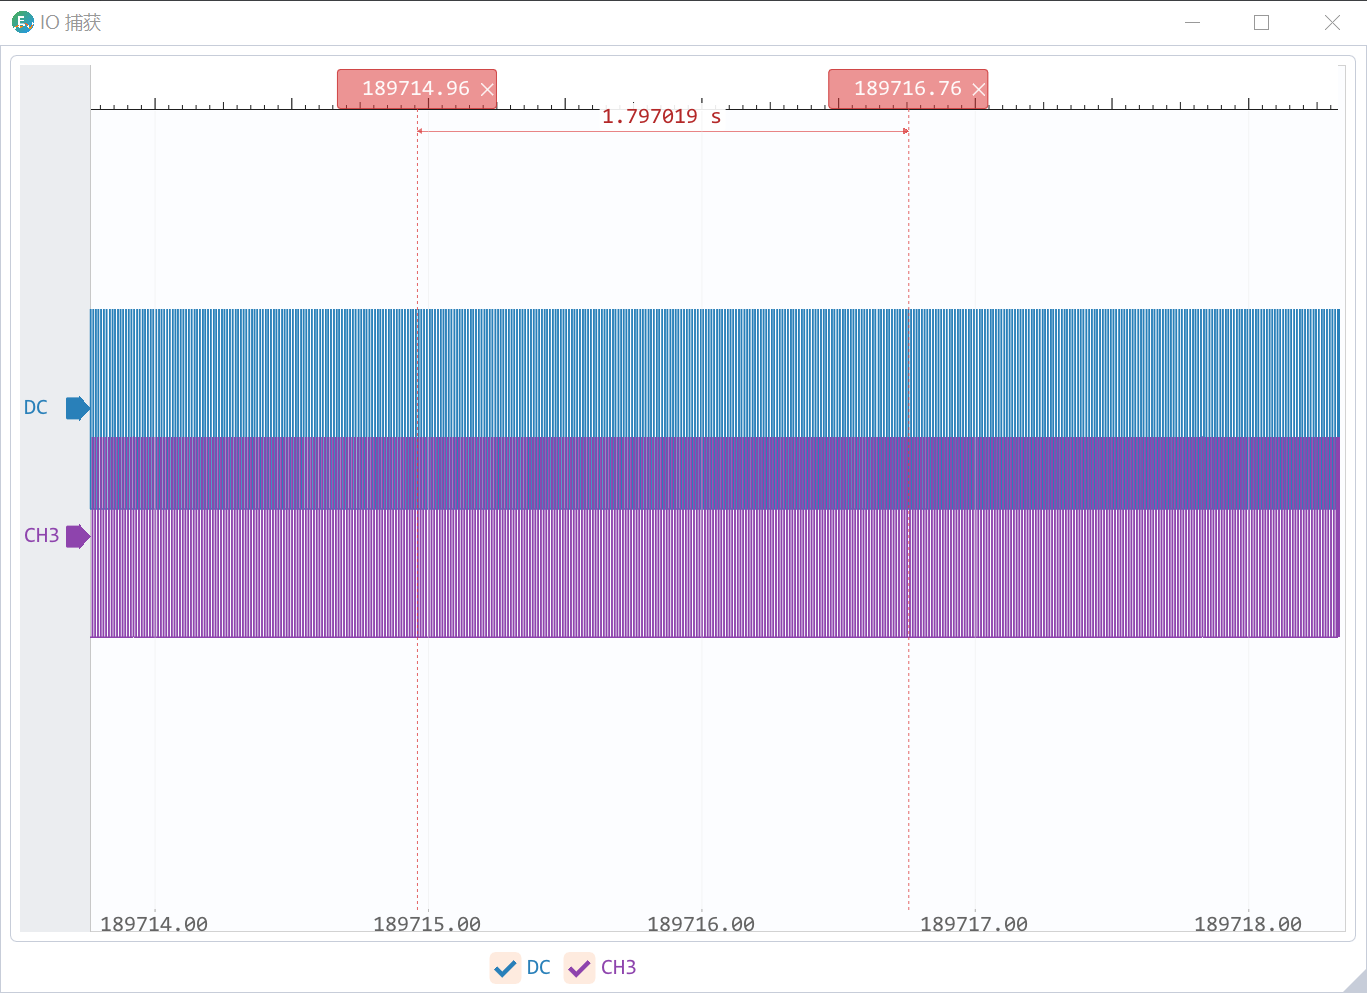
9. IO capture analysis
The IO capture window is used to observe changes in external IO signals and assist in analyzing the relationship between network events and actual actions.
Operation points:
Mouse wheel zoom horizontal axis.
The upper scale bar can measure the time difference.
Channel symbols can be dragged up and down.
Right click the mouse to jump to the corresponding data frame.
Typical uses:
Analyze the time relationship between external trigger signals and EtherCAT messages.
Observe the sequence of device actions, IO flips and network status changes.
There was a short-term abnormality at the review site.
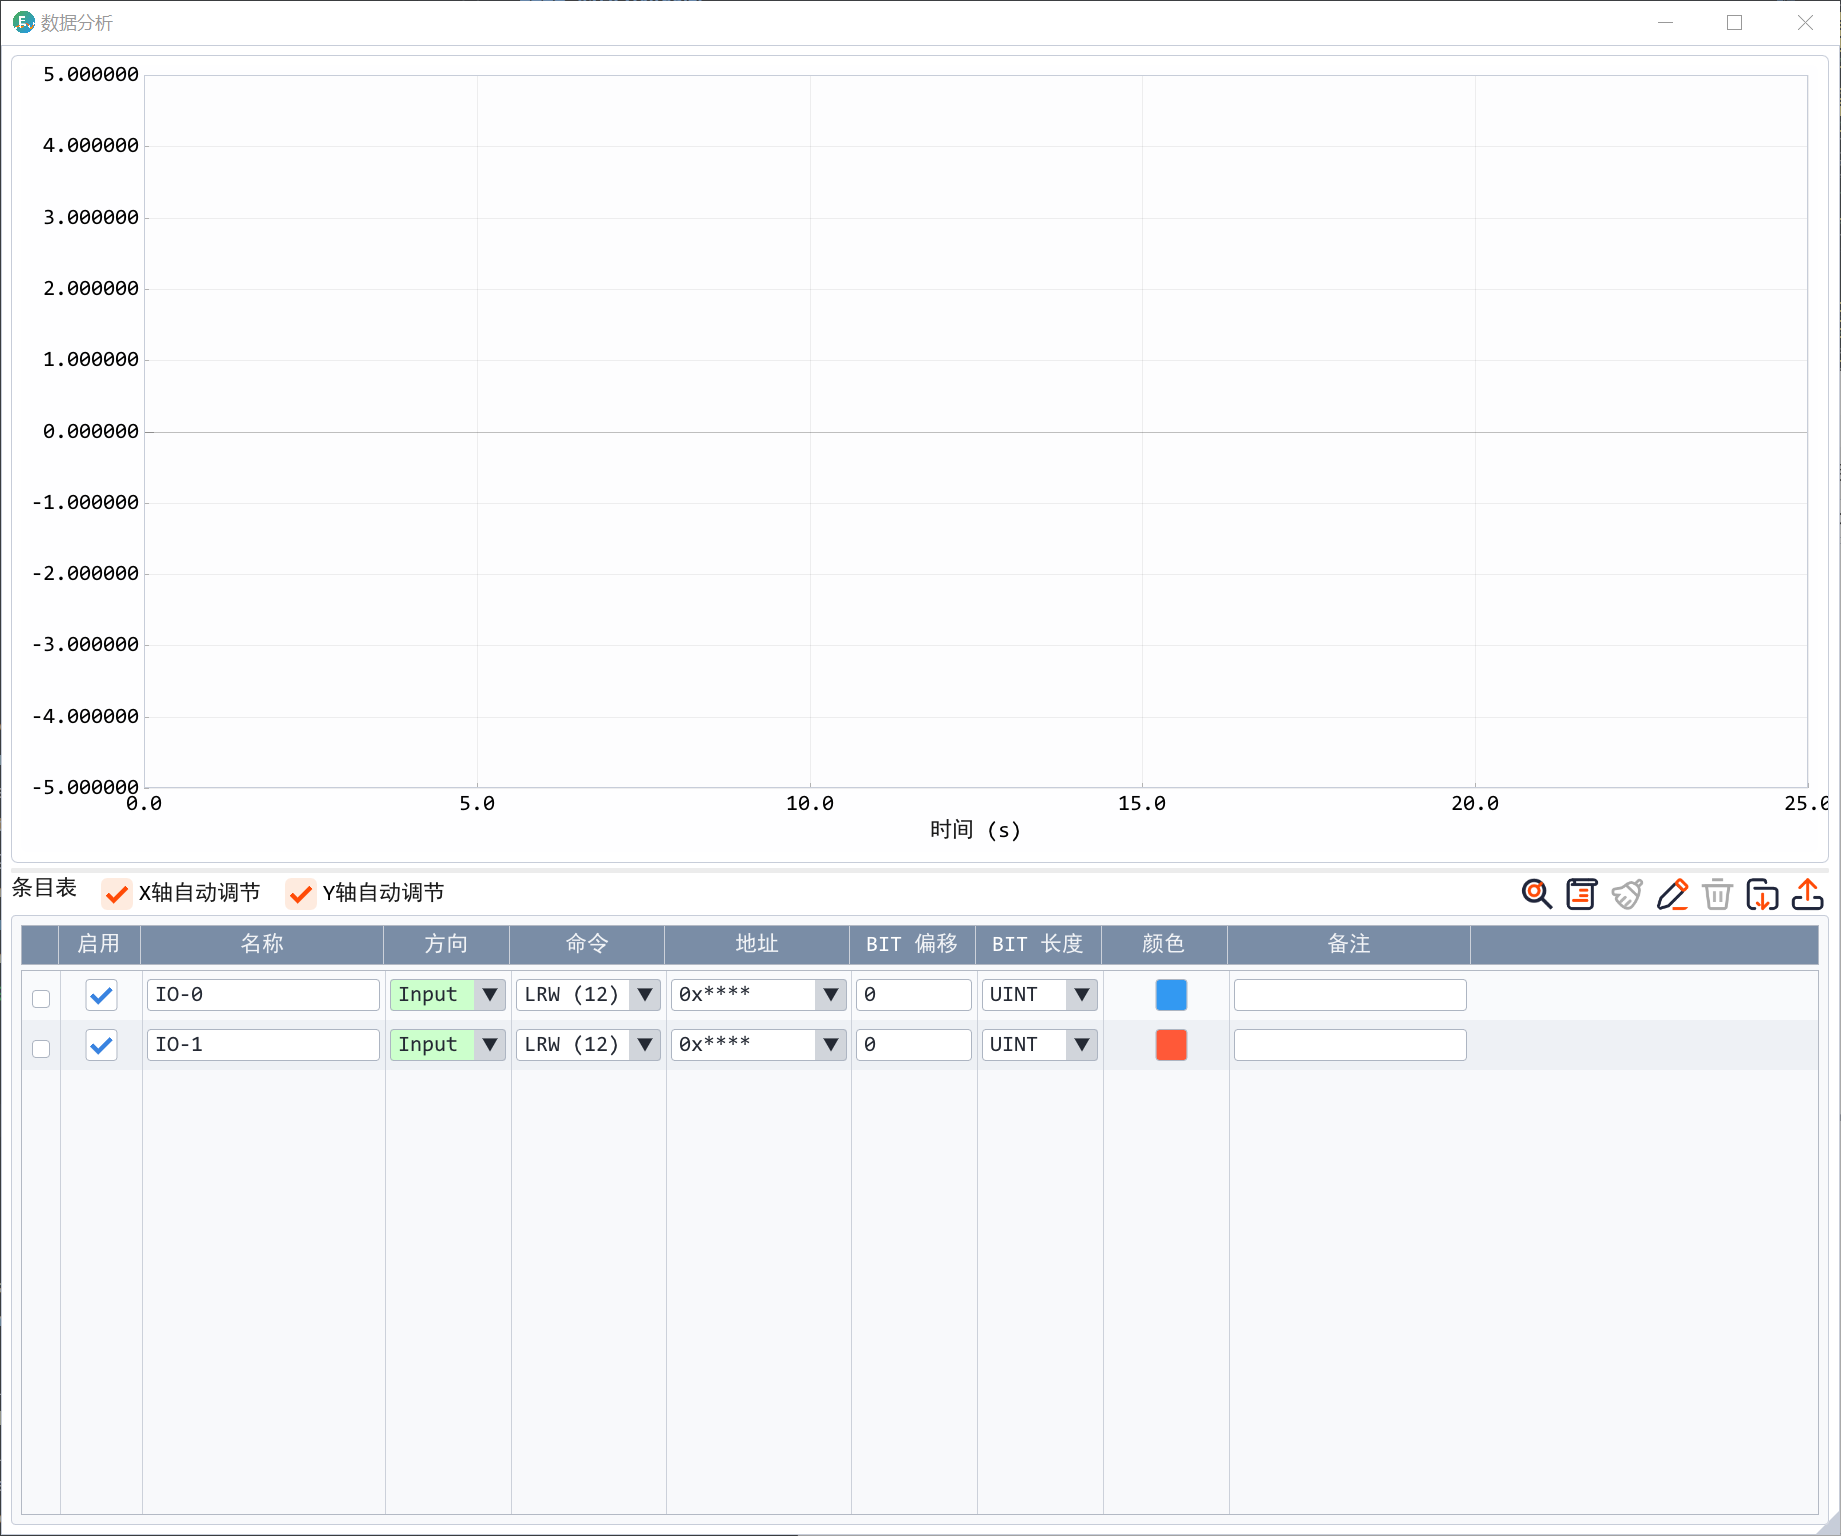
10. PDO data analysis
PDO data analysis is suitable for converting EtherCAT process data into curves, such as position, speed, status words, control words, sensor values, etc.
Tool buttons:
Icon
Function
PDO automatic selection
Current entry summary information
Clear cache data
Manual entry
Delete selected entry
Save entry configuration
Select or import an XML file
10.1 PDO automatic selection
Recommended process:
Capture or open the pcap containing the EtherCAT initialization process.
Configure the ESI XML directory in settings.
Open the data analysis window.
Click PDO Auto Select.
The software recognizes the slave and PDO configuration.
Select all slaves or a single slave as required.
Add target items to the chart.
If the slave is not detected or the XML cannot be matched, please confirm:
Whether the packet capture includes the complete initialization process.
Whether the XML directory is configured correctly.
Whether the target device XML exists.
10.2 PDO manual selection
When automatic matching does not meet your needs, you can choose manually:
Select the ESI XML file.
View TxPDO/RxPDO entries.
Filter by module or pattern.
Click the Add button to join the data analysis list.
Manually adjust the direction, command, address, offset and length if necessary.
11. Alarm and time jump
The alarm function is used to monitor status changes. Typical example:
EtherCAT status changes from OP to SafeOP.
The error bit in the status word has changed.
The specified PDO data exceeds the expected range.
Time jumps are used to locate messages directly from charts, alarms or external records. After you enter a target time point, the software jumps to a frame close to that time.
12. Blocked packet capture and caching
Blocked packet capture will automatically divide the packet capture data into multiple small files to prevent a single temporary file from being too large.
Configurable in settings:
Group size.
Cache directory.
Whether to keep the old cache before the next startup.
Note:
In the default temporary directory, old caches are usually cleared on the next startup.
Please use the save button to save important packet captures as pcap.
Disk space should be confirmed before capturing packets for a long time.
13. Recommended workflow
Suggested process for reproducing on-site problems:
Connect the analyzer and host computer.
Start capturing packets before the device is powered on or the master station is started.
Reproduce the problem.
Stop capturing packets and save pcap.
Use filters to locate abnormal phases.
Open timing analysis to observe period changes.
Open PDO data analysis to observe key process data.
Configure alarms and time jumps if necessary.
File the pcap, screenshots, and conclusions together.
It is recommended to keep at least the following for each issue review:
Original pcap file.
ENET-Analyzer version.
Photos or topology diagrams of field wiring.
Screenshots of key time points.
Timing analysis PDF report.
If using PDO analysis, keep the XML file and entry configuration.
14. FAQ
14.1 The network card list is empty
Possible reasons:
Npcap is not installed.
Npcap unchecks WinPcap compatibility mode.
The host computer has insufficient authority.
The system network card status is abnormal.
Processing:
Reinstall Npcap.
Check WinPcap API-compatible Mode.
Restart the host computer.
Restart the computer if necessary.
14.2 Failed to automatically find the device network card
Check:
Whether the UP port is connected to the computer's Gigabit network card.
Whether the network cable is normal.
Whether the computer network card negotiates at Gigabit rate.
Whether the yellow LED is flashing.
Processing:
Manually select possible network cards and start packet capture verification.
Replace the network cable or computer network port.
Avoid connecting to 100M only USB network cards or switch ports.
14.3 Unable to catch EtherCAT messages
Check:
Whether the field link is connected to the IN / OUT detection port.
Whether the master station has started communication.
Whether the IN / OUT port speed is 100Mbps.
Whether the UP port is connected to the computer's Gigabit network card.
Whether the wrong packet capture network card was selected.
Suggestions:
Start capturing packets before the master station starts.
Without using the filter, confirm whether the original packet enters the list.
Use Wireshark to open the saved pcap for cross-validation.
14.4 Timing analysis does not automatically identify DC frames
Possible reasons:
The captured packet does not contain DC synchronization frame.
The DC configuration method used by the master station is not within the scope of automatic identification.
The starting point of packet capture is too late, lack of initialization or key cycle frame.
Processing:
Manually configure DC cycle command, address and command length.
Capture packets again before starting from the master station.
Check the Datagram Header in the message details to confirm the matching conditions.
14.5 PDO automatic selection has no results
Possible reasons:
pcap does not contain the full EtherCAT initialization process.
ESI XML directory is not configured.
The XML file does not match the field device.
Multi-axis or modular equipment configuration is more complex and requires manual selection.
Processing:
Configure the XML directory in settings.
Verify that pcap contains the initialization process.
Try device sequence summary to see matching status.
Use PDO to select manually if necessary.
14.6 Open pcap displays very little data
If the pcap was not generated by the analyzer link, it may be missing critical timestamp or format information. The software will filter unrecognizable data and only display limited content or statistical tips.
Suggestions:
Use ENET-Analyzer to re-capture packets.
Use Wireshark when common protocol viewing is required.
14.7 Device red LED is not off
A red LED that comes on and then doesn't turn off usually means the device is not starting up properly.
Processing:
Re-plug the USB.
Replace the USB cable or USB port.
If it still cannot be restored, contact technical support.
14.8 Yellow LED flashes
A flashing yellow LED usually indicates that the network port is not connected correctly or that the negotiated rate does not match.
Processing:
Confirm that the UP port is connected to a Gigabit network card.
Verify that the IN/OUT probe ports are connected to a 100Mbps link.
Replace the network cable.
15. Minimum Checklist
Question
Priority Check
No network card
Npcap and WinPcap compatibility mode
No data
Network card selection, UP port Gigabit connection, whether the on-site link is communicating
No EtherCAT
Did you choose the wrong network card and connected it to the detection port
No timing results
Whether there is a DC frame and whether manual configuration is required
No PDO result
Is there an initialization process and is the XML directory correct
No report output
Whether time series data already exists and whether a valid saving path is selected